The decision to migrate from SAS to a modern cloud analytics platform is rarely driven by technology alone. It is a financial decision. CIOs and CFOs need to see a clear return on investment before committing budget, headcount, and organizational bandwidth to a multi-quarter migration program. This article provides a structured framework for calculating the ROI of migrating SAS workloads to Snowflake, Databricks, or a combination of both.
We will break down the total cost of ownership (TCO) on both sides of the equation, examine where automated migration tools shift the math, and provide realistic benchmarks drawn from enterprise migration projects.
Understanding the Current SAS Cost Structure
SAS licensing is famously opaque, but the major cost components are well-known. Most enterprises running SAS at scale carry annual expenses across four categories:
1. Software Licensing
SAS licenses are typically sold as annual site licenses or per-server licenses. The cost depends on which products are deployed. SAS Base, SAS/STAT, SAS/ETS, SAS/GRAPH, SAS Enterprise Guide, SAS Management Console, and SAS Data Integration Studio each carry separate license fees. A mid-market enterprise running a full SAS stack commonly pays between $500K and $2M annually in licensing alone. Large financial institutions and healthcare organizations can spend $5M or more.
2. Infrastructure
SAS runs on dedicated servers, either on-premise or in a cloud VM. These servers need significant memory (often 256GB to 1TB RAM per node), fast local storage for the SAS WORK library, and multi-core CPUs for SAS/CONNECT grid computing. Annual infrastructure costs for a production SAS environment, including dev, staging, and DR, typically range from $200K to $800K.
3. Personnel
SAS administration requires specialized skills. Most enterprises employ at least two to three dedicated SAS administrators, plus a pool of SAS developers whose market rate is elevated by the proprietary skill set. SAS developer salaries average $110K to $140K in the US market, while Python/PySpark developers average $120K to $150K but are far more abundant in the talent pool.
4. Opportunity Cost
This is the hardest cost to quantify but often the largest. SAS environments are difficult to scale elastically, slow to provision for new projects, and increasingly disconnected from the modern data ecosystem. Every month spent waiting for a SAS server upgrade or a license procurement cycle is a month of delayed analytics capability.

MigryX migration methodology — Discover, Convert, Validate, Deploy
Total Cost of Ownership Comparison
The following table compares annual TCO for a representative mid-market enterprise running 2,000 SAS programs with 50TB of processed data.
| Cost Category | SAS (Annual) | Snowflake/Databricks (Annual) | Savings |
|---|---|---|---|
| Software Licensing | $1,200,000 | $0 (open-source Python/PySpark) | $1,200,000 |
| Platform Compute | $0 (bundled in license) | $300,000 - $500,000 | ($300K - $500K) |
| Platform Storage | $0 (on-prem) | $25,000 - $50,000 | ($25K - $50K) |
| Infrastructure (servers, DR) | $450,000 | $0 (managed service) | $450,000 |
| SAS Administration (2.5 FTE) | $325,000 | $0 (no SAS admin needed) | $325,000 |
| Cloud Platform Admin (0.5 FTE) | $0 | $75,000 | ($75,000) |
| Developer Talent Premium | $150,000 (above market) | $0 | $150,000 |
| Total Annual TCO | $2,125,000 | $400,000 - $625,000 | $1,500,000 - $1,725,000 |
For this representative scenario, the annual savings range from $1.5M to $1.7M, representing a 70-80% reduction in total cost of ownership.
MigryX Compass: From Chaos to Clarity
Every enterprise migration starts with the same challenge: understanding what you actually have. MigryX Compass scans your entire legacy estate — SAS programs, ETL jobs, stored procedures, macro libraries — and delivers a complete dependency graph, complexity score for every asset, and a recommended migration wave plan. What takes consulting teams weeks of manual inventory work, MigryX Compass accomplishes in hours.
Migration Investment: Manual vs. Automated
Of course, realizing those savings requires an upfront investment in the migration itself. This is where the choice between manual and automated migration dramatically changes the ROI calculus.
Manual Migration Costs
Manual migration relies on developers reading SAS code, understanding its intent, and rewriting it in Python, PySpark, or SQL. Industry benchmarks show that an experienced developer can manually convert and validate approximately 15 to 25 SAS programs per month, depending on complexity. For a 2,000-program estate:
- Duration: 18 to 24 months with a team of 6 to 8 developers
- Developer cost: $1.8M to $2.8M (including benefits and overhead)
- Risk of rework: A significant portion of manually converted programs require rework after initial validation
- Total estimated cost: $2.2M to $3.5M
Automated Migration Costs
Automated migration uses a purpose-built conversion engine to handle the deterministic translation of SAS constructs, with engineers focusing on edge cases and optimization. With automation, the same estate can be migrated in a fraction of the time:
- Duration: 4 to 8 months with a team of 3 to 4 engineers
- Tooling cost: Tooling and platform licensing costs vary based on scope and target platform
- Engineering cost: $400K to $600K (reduced team, shorter timeline)
- Risk of rework: Minimal rework rates (automated validation catches errors before delivery)
- Total estimated cost: $600K to $1.0M
The Automation Multiplier
Automated migration does not just reduce cost. It compresses timelines by 60-75%, which means you start realizing annual savings 12 to 18 months sooner. Over a three-year horizon, this acceleration can be worth more than the direct cost savings of the migration itself.
Payback Period Analysis
Payback period is the simplest and most compelling metric for executive stakeholders. It answers the question: "How long until this investment pays for itself?"
Manual Migration Payback
With a $2.8M average migration cost and $1.6M annual savings, the payback period for manual migration is approximately 21 months. However, since manual migration itself takes 18-24 months, actual positive cash flow does not begin until roughly month 36 to 42.
Automated Migration Payback
With an $800K average migration cost and the same $1.6M annual savings, the payback period is approximately 6 months after completion. Since automated migration completes in 4-8 months, the total time to positive cash flow is approximately 10 to 14 months from project kickoff.
| Metric | Manual Migration | Automated Migration |
|---|---|---|
| Migration Cost | $2.2M - $3.5M | $600K - $1.0M |
| Migration Duration | 18 - 24 months | 4 - 8 months |
| Annual Savings (post-migration) | $1.5M - $1.7M | $1.5M - $1.7M |
| Payback Period (from kickoff) | 36 - 42 months | 10 - 14 months |
| 3-Year Net Savings | $1.3M - $1.9M | $3.6M - $4.4M |
| 5-Year Net Savings | $4.5M - $5.5M | $6.8M - $7.8M |
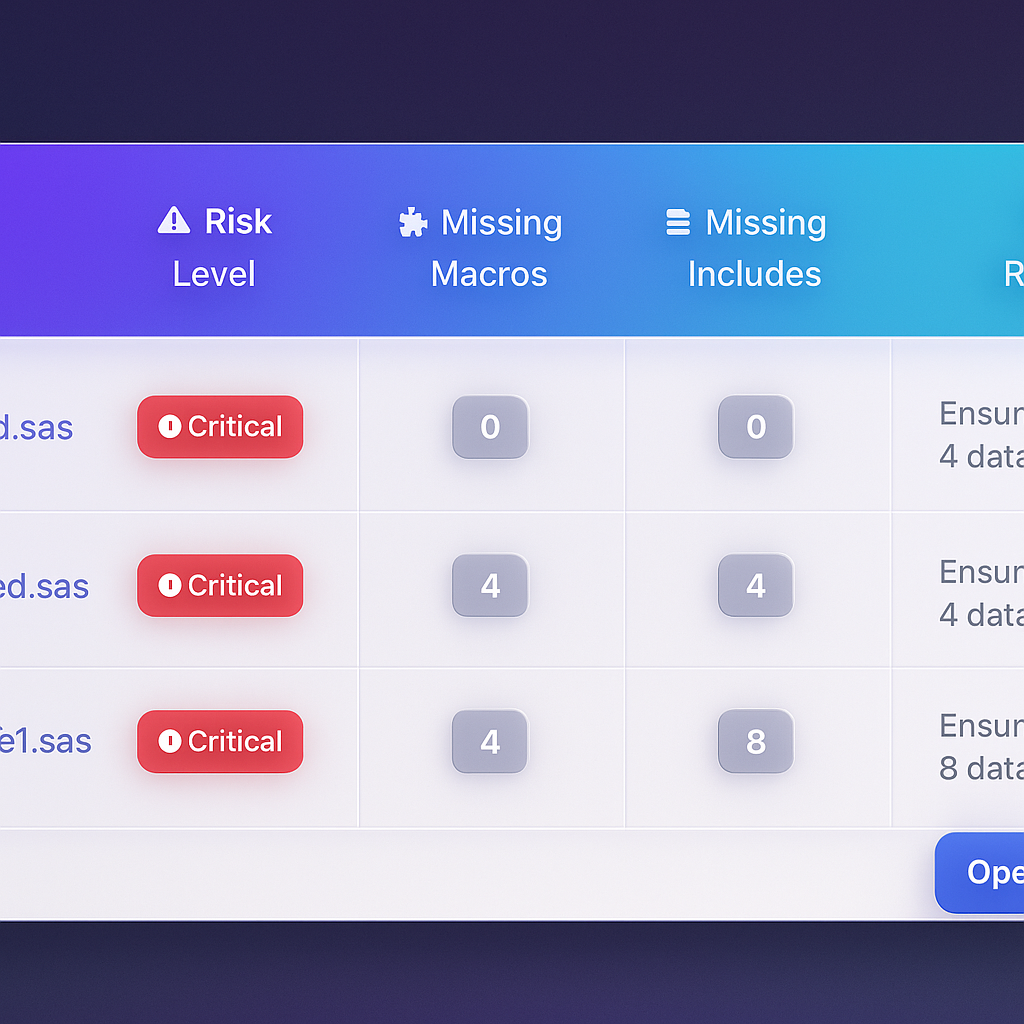
MigryX risk analysis identifies high-complexity programs and recommends optimal migration sequencing
Data-Driven Migration Planning with MigryX
MigryX does not just estimate complexity — it quantifies it. Every program receives a composite score based on lines of code, unique constructs, macro nesting depth, external dependencies, and data volume. Program managers use these scores to build realistic wave plans, allocate resources accurately, and set expectations with stakeholders based on data, not guesswork.
Risk Reduction as ROI
Financial savings are the headline, but risk reduction contributes substantially to the business case. Consider these risk factors that improve with migration:
- Vendor lock-in risk. SAS contract negotiations become increasingly difficult as your dependency deepens. Moving to open-source languages and cloud-native platforms eliminates single-vendor leverage.
- Talent risk. The pool of experienced SAS developers is shrinking as universities and bootcamps teach Python. Every year of delay makes future hiring harder and more expensive.
- Compliance risk. Modern platforms provide native encryption, audit logging, role-based access control, and data classification capabilities that are increasingly required by regulators.
- Scalability risk. SAS environments hit hard ceilings on data volume and concurrent users. Cloud platforms scale horizontally without procurement cycles.
- Business continuity risk. Cloud-native platforms offer built-in multi-region redundancy that would require significant additional investment to replicate in an on-premise SAS environment.
Beyond Cost: Strategic Business Value
The strongest business cases go beyond cost reduction to quantify strategic value:
Faster Time to Insight
Cloud platforms with elastic compute can process workloads that took hours in SAS in minutes. Analysts get results faster, decisions happen sooner, and the business moves at a higher tempo.
Expanded Analytics Capability
Once on Snowflake or Databricks, teams gain native access to machine learning libraries, streaming analytics, unstructured data processing, and the broader Python ecosystem. These capabilities are either impossible or prohibitively expensive in SAS.
Improved Developer Productivity
Modern development environments with Git-based version control, collaborative notebooks, CI/CD pipelines, and infrastructure-as-code eliminate the friction that characterizes SAS development workflows.
Building Your Business Case
To build a credible ROI analysis for your specific organization, gather the following data points:
- Current SAS license renewal cost (ask procurement for the most recent invoice).
- Server infrastructure costs allocated to SAS (ask IT finance).
- Headcount dedicated to SAS administration and development (ask HR).
- Number of SAS programs in production (run a file system scan).
- Total data volume processed by SAS pipelines (check SAS logs).
- Estimated Snowflake or Databricks consumption for equivalent workloads (request a sizing assessment from the vendor or from MigryX).
With these inputs, you can populate the framework above and produce a defensible three-year and five-year TCO comparison that will withstand CFO scrutiny. The numbers consistently tell the same story: automated migration to modern cloud platforms pays for itself within 12 months and delivers cumulative savings measured in millions.
Why MigryX Is the Foundation of Every Successful Migration
The challenges described throughout this article are exactly what MigryX was built to solve. Here is how MigryX transforms this process:
- Automated discovery: MigryX Compass scans thousands of programs and produces a complete inventory with dependency mapping in hours.
- Complexity scoring: Every asset is scored by code complexity, data volume, and business criticality — enabling precise effort estimation.
- Wave planning: MigryX recommends optimal migration waves based on dependencies, ensuring no pipeline breaks mid-migration.
- 4-8x faster delivery: Enterprises using MigryX consistently report migration timelines compressed from years to months.
MigryX combines precision AST parsing with Merlin AI to deliver 99% accurate, production-ready migration — turning what used to be a multi-year manual effort into a streamlined, validated process. See it in action.
Ready to modernize your legacy code?
See how MigryX automates migration with precision, speed, and trust.
Schedule a Demo